
Capitulation Watch
How close are we to a bottom, and what I'm watching to find out...

Marlin Capital Readers,
The S&P 500 just notched its 4th consecutive weekly loss, its longest losing streak since the 2025 Liberation Day meltdown. In the last 20 years, we have only seen a handful of longer streaks for the SPX.
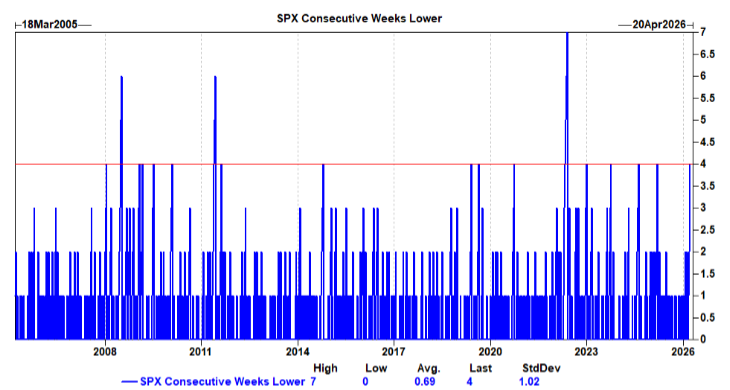
Over the past 4 weeks, the SPX has fallen ~6%. The index is now down -6.8% from its January highs.
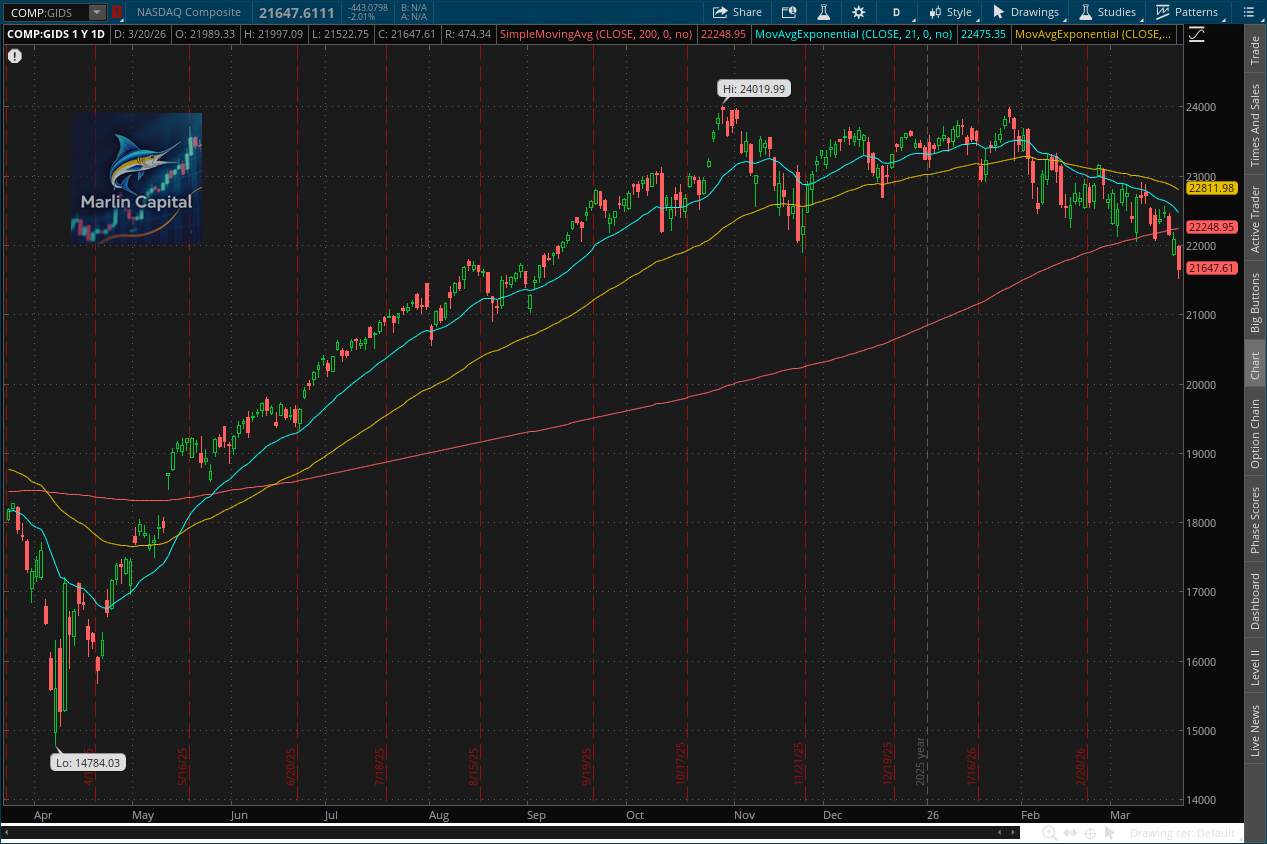
The Nasdaq has finished lower in 7 of the last 8 weeks, and is now approaching official correction territory (down ~9% from highs).
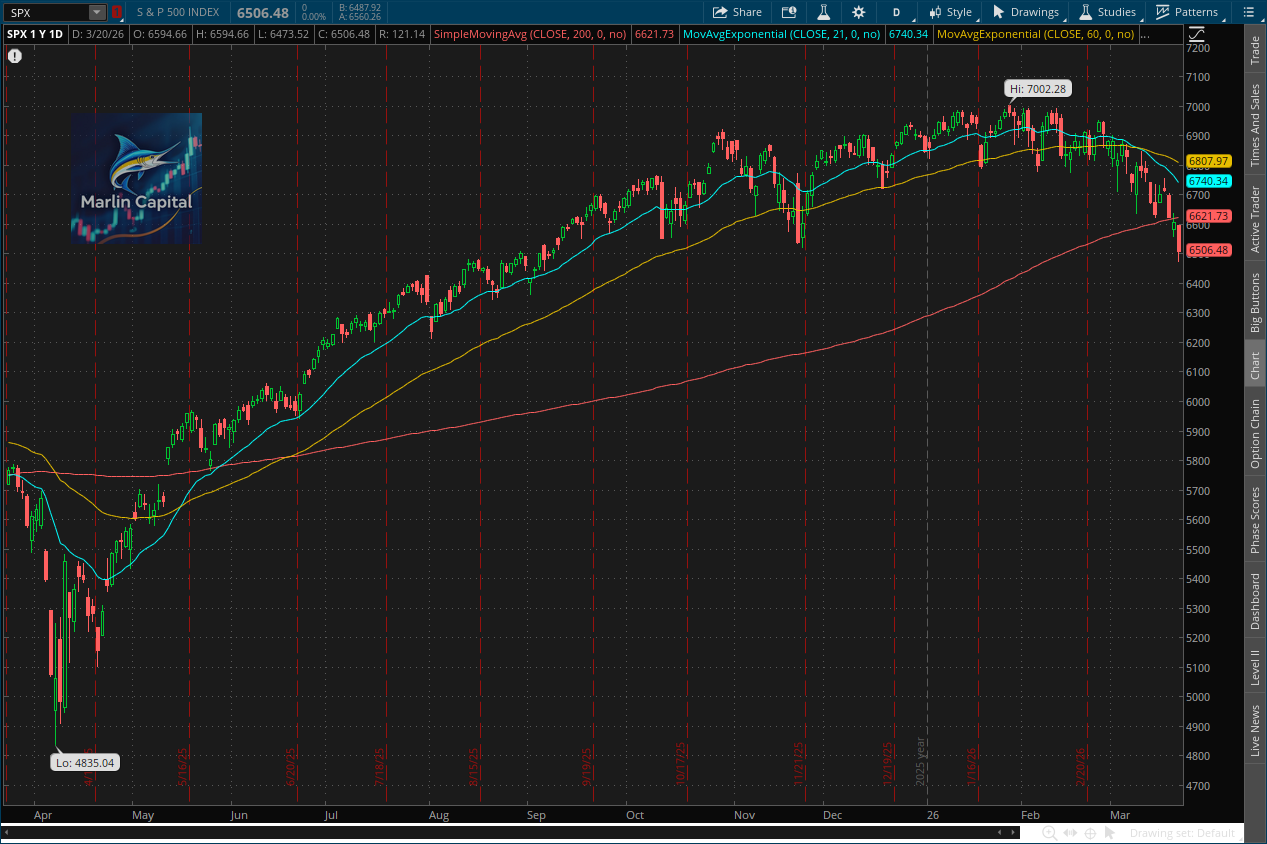
Most importantly, both the S&P 500 and the Nasdaq closed below their 200-day SMAs this week for the first time since May 2025.
SPX 👇
Nasdaq 👇
In “Headwinds”, I walked through every major headwind plaguing this market right now, from the Iran war sending oil prices parabolic, to the AI labor market shakeup accelerating, to credit conditions deteriorating, to the overall technical picture confirming a downtrend.
All of those headwinds remain firmly in place heading into this week.
So, the 2 main questions I want to focus on tonight are simple. 👇
How close are we to a bottom?
And where are we on my capitulation scale?
These are the most important questions in the market right now, in my view. And the answers may surprise you.
In “Headwinds” last week, I laid out the 3 main things I am watching before deploying long-term capital. One of those was positioning data.
Positioning data was the main factor that helped us time the April 2025 Liberation Day lows (within 2 days of the exact market bottom). And right now, it is telling me something very important. 👇