
The First Pause
The first real pullback in a month. My buy zones and the 2 stocks at the top of my watchlist...

Marlin Capital Readers,
US stocks finished higher last week, but the way the week ended is the key thing I’m focused on.
The S&P 500 and Nasdaq both hit new ATHs on Thursday before Friday’s big selloff erased most of the week’s gains (SPX -1.2%, NDX -1.5%, RTY -2.4%).
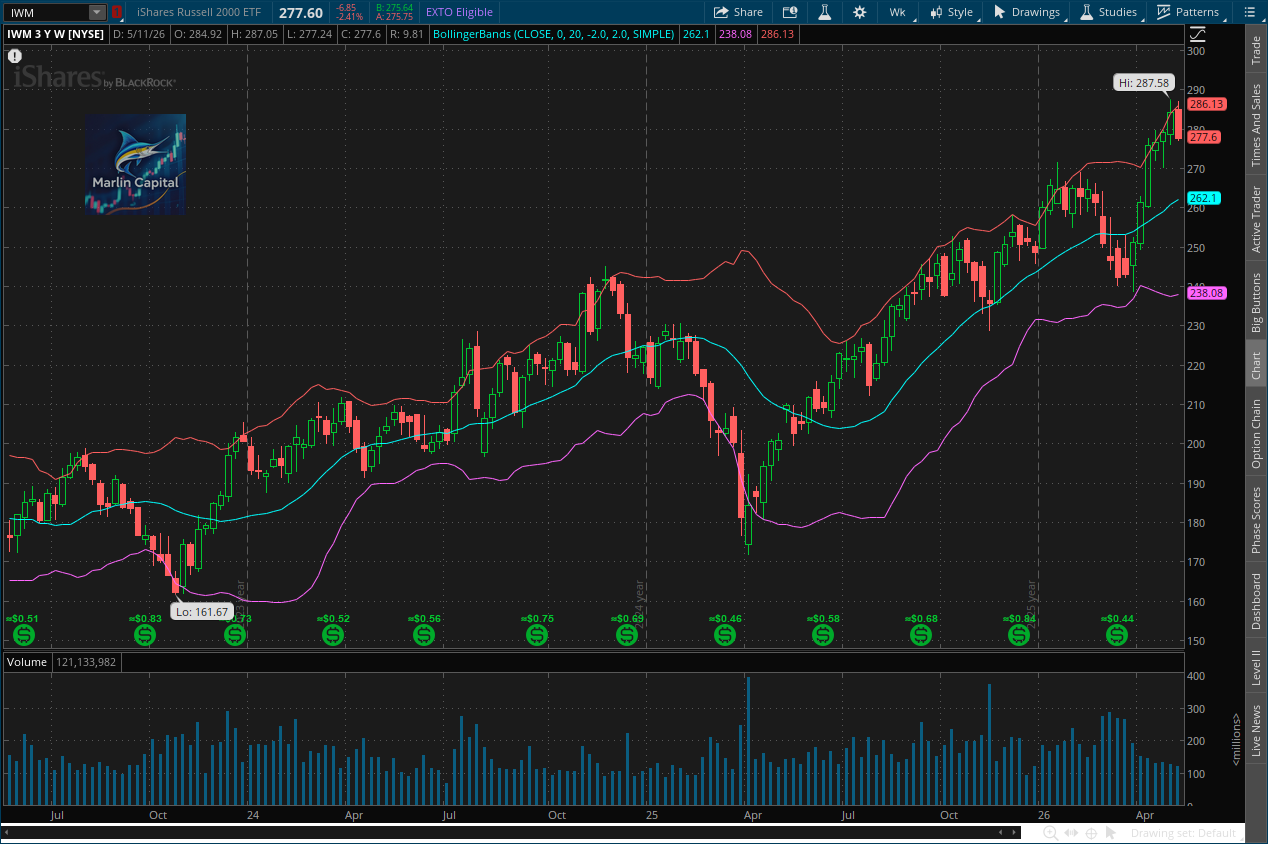
The S&P 500 and Nasdaq finished the week up just +0.1%. The Russell 2000 finished -2.3%, snapping a 6 week winning streak.
After 7 straight green weeks on the NDX, Friday was the first real shakeout of this rally.
Let me explain what caused it, why it is healthy, and exactly what I am looking for next. 👇
What Caused the Pause
3 things converged last week, and the market finally took notice on Friday.
1. The PPI bomb.
April PPI came in at +1.4% MoM on Wednesday, the biggest monthly jump since March 2022 and nearly 3x the +0.5% estimate. YoY PPI hit +6%, the largest increase since December 2022. Core PPI (ex food and energy) jumped +1% MoM vs the +0.4% estimate. This came one day after a hot CPI print (+3.8% YoY). The Iran war and the resulting energy spike are the main drivers, but the inflation pressure is broadening beyond just energy.
2. Yields ripped to new YTD highs.
10Y Treasury yields surged 14 bps on Friday alone to 4.59%, its highest level since February 2025. The 30Y jumped 11 bps to 5.12%, a new YTD high. Rate hike odds for 2026 are now sitting near 50%, with a hike fully priced in by March 2027. The Bond Market is no longer buying the “rate cuts are coming” narrative anymore.
3. The Warsh Handoff.
Kevin Warsh officially takes over as Fed Chair tomorrow (Monday). He was confirmed on Wednesday in a 54-45 vote. He inherits a difficult setup with a +6% PPI print and a +3.8% CPI print last week. Warsh’s first FOMC meeting is June 16-17. There is some anxiety heading into that meeting. The market has been quietly leaning on Warsh being the “dove Trump wants” who will deliver rate cuts. But the inflation data from last week makes that an extremely difficult hand to play.
The combination of these 3 factors finally broke the vertical rally on Friday.
Semis got hit the hardest after their massive run, with MU -6.6%, AMD -5.7%, INTC -6.2%, and NVDA -4.4% (heading into earnings this week). The biggest winners of the past month (Semis) gave back the most. This is classic profit taking.
Let’s take a look at the weekly charts on the major indices heading into the week of 5/18. 👇
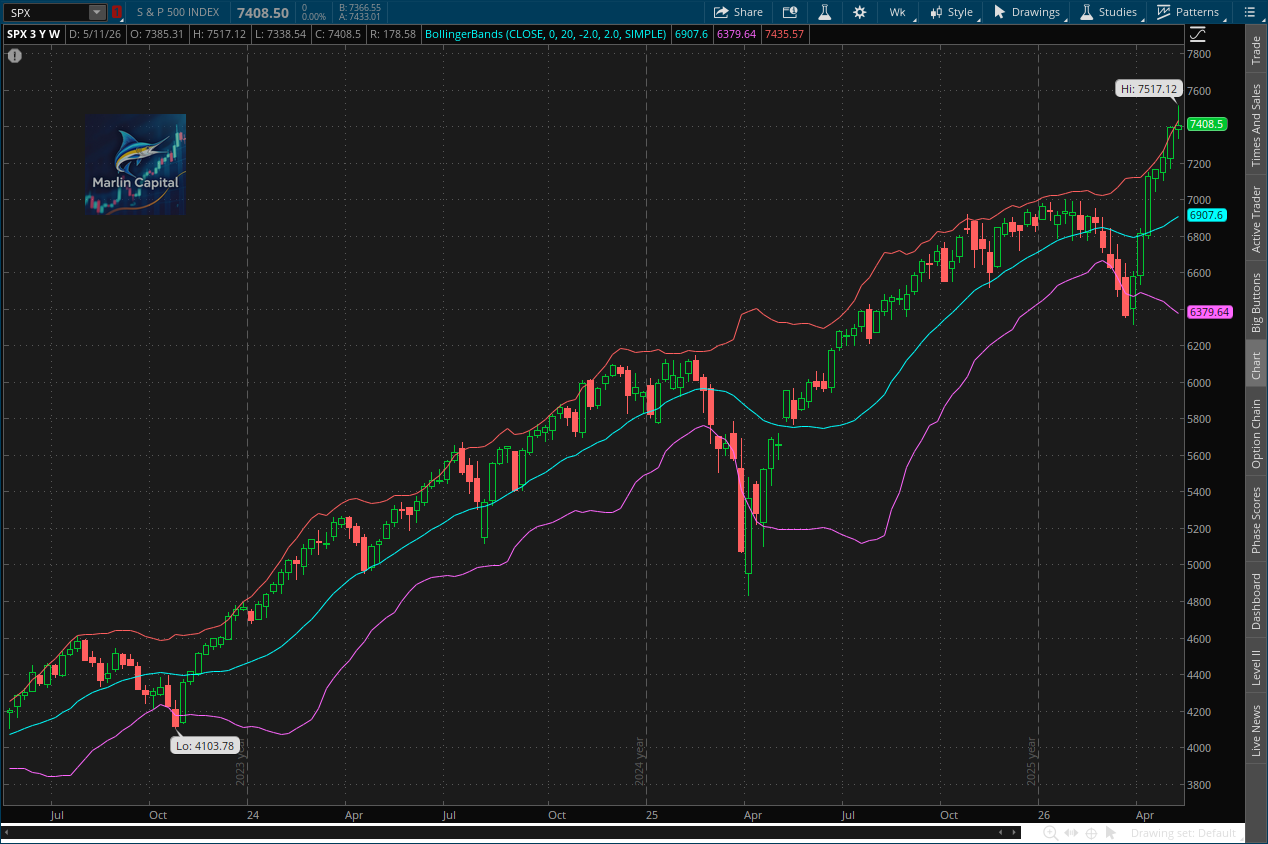
SPX Weekly 👇
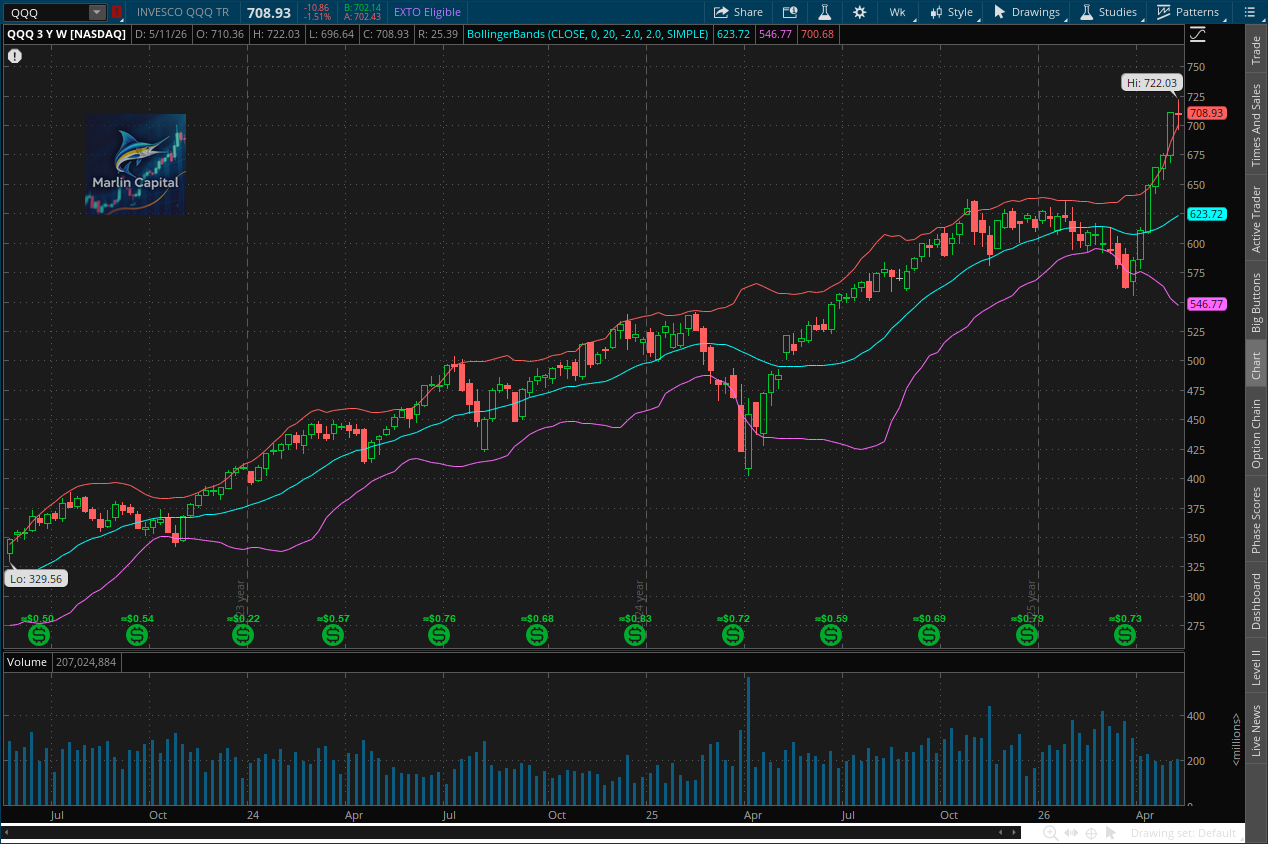
QQQ Weekly 👇
IWM Weekly 👇
SOX Weekly 👇
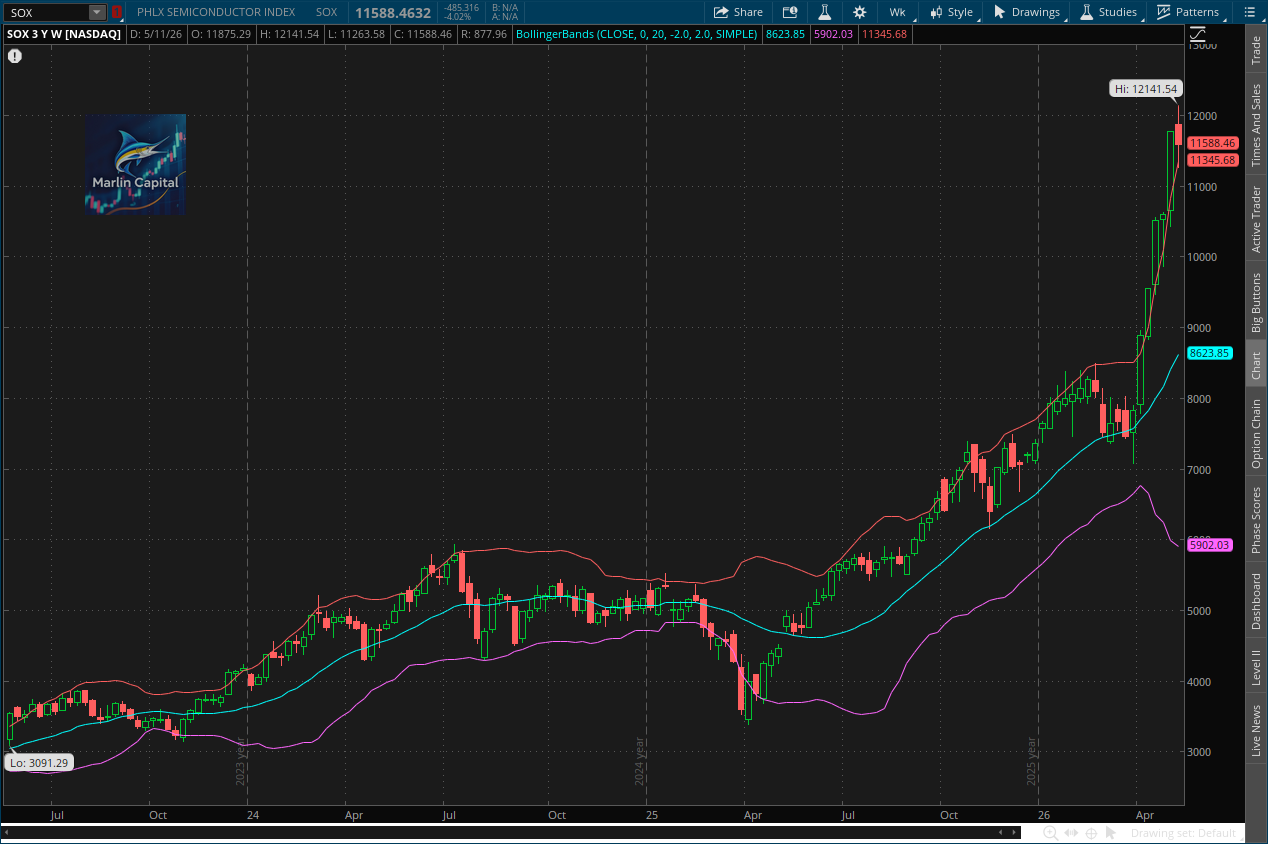
The SPX, QQQ, and SOX all formed spinning top weekly candles while trading outside their upper Bollinger Bands. The SOX in particular closed completely outside its upper Bollinger Band (with a bearish spinning top candle), the strongest exhaustion signal we have seen to date.
When you see this kind of price action across all the major indices simultaneously, the message becomes more clear. The lockout rally is tired, and it looks like it needs its first rest.
This is not a bearish development, though. This is the market doing exactly what it should do after a month straight of vertical price action.
The Historical Parallel
In “Summer Melt Up” last Wednesday, I compared this 2026 rally to the 2025 post-Liberation Day rally, and laid out my expectation for what would come next.